

Back in April I shared our 2025 price survey, and the headline was simple: residential solar in New Zealand costs roughly $2 per watt installed. I also said I didn't expect prices to drop in 2026.
So, was I right? We now have 100 more real installs from Kiwi homeowners, covering 1 January to 4 November 2026. Normally I'd wait until the year is over, but I'll admit I was too excited to see the results, so we're publishing early this year. These are prices people actually paid. Not quotes, not list prices, and not an installer's best-case brochure number.
Short answer: the $2 per watt benchmark is still holding. But underneath that flat headline a few things have shifted. Systems are getting bigger, more people are adding batteries, and batteries got a little cheaper per kWh.
I think prices did creep up slightly, but it's hidden by the fact that people went bigger this year. Bigger systems bring economies of scale, which makes them cheaper per watt. Put that against the higher cost of solar panels and you end up with a price per watt that has barely moved.
This year has been marked by the fuel crisis, and demand for solar hit a new level as Kiwi households thought more about energy resilience. That kept existing installers extremely busy. At the same time, plenty of electrical companies saw it as a good time to start a solar department, and I believe those new players helped keep prices in check despite the higher demand.
Key takeaways at a glance
- Average solar price in 2026: $2.04 per watt installed (incl GST). Exactly the same as 2025.
- Prices are more consistent. Half of all installs landed between $1.82 and $2.23 per watt, a tighter range than last year ($1.74 to $2.36).
- Systems are getting bigger. Average size jumped from 7.89 kW to 9.03 kW (in line with the latest Electricity Authority data), and 10 kW was the most common size.
- A typical 7 to 8 kW system now averages $16,344, up from $15,458 in 2025.
- Almost half (48%) of installs included a battery, and another 24% went battery-ready.
- Battery prices eased slightly to $1,165 per kWh installed, down from $1,219.
- Tesla Powerwall 3 was the most popular battery (44% of battery installs), followed by Sigenergy (27%).
2025 vs 2026 side by side
| Measure | 2025 | 2026 (to 4 Nov) | Change |
|---|---|---|---|
| Solar responses | 151 | 100 | |
| Average price per watt | $2.04 | $2.04 | No change |
| 25th percentile (cheaper quarter) | $1.74 | $1.82 | +8c |
| 75th percentile (dearer quarter) | $2.36 | $2.23 | -13c |
| Standard deviation | $0.43 | $0.36 | Tighter spread |
| Average system size | 7.89 kW | 9.03 kW | +1.14 kW (+14%) |
| Median system size | 7 kW | 8.7 kW | +1.7 kW |
| Average cost, 7 to 8 kW system | $15,458 | $16,344 | +$886 (+6%) |
| Installs with a battery | 42% | 48% | +6 points |
| Average battery price | $13,024 | $13,285 | +$261 (+2%) |
| Average battery price per kWh | $1,219 | $1,165 | -$54 (-4%) |
| Average battery size | 11.1 kWh | 11.5 kWh | +0.4 kWh |
| Most common battery size | 13.5 kWh | 13.5 kWh | No change |
| Batteries 13 kWh+, per kWh | $1,105 | $1,120 | +$15 (+1%) |
All prices include GST. Price per watt is for the solar portion only (battery costs are separated out).
The $2 per watt benchmark still holds
Across 100 installs the average came in at $2.04 per watt, and the median at $1.99. Last year's average was $2.04 too. You can't get much flatter than that.
This isn't me rounding to make a neat headline either. Statistically there's no difference between the two years.
That matters, because in April I flagged three reasons prices might creep up: rising freight costs, China removing export tax rebates on solar panels, and strong local demand keeping installers busy.
Those pressures were real. China scrapped its export tax rebates on solar panels from 1 April, and the benchmark price for Chinese panels was about 20% higher in October than in mid-December. Two more things added pressure for Kiwi buyers specifically. Freight rates out of China more than doubled, with the Shanghai Containerized Freight Index going from around 1,650 in early January to over 3,600 by November. And the New Zealand dollar weakened to around 57 US cents, down from about 60 cents in February, which makes anything priced in US dollars dearer here. Even so, panels are typically only about a quarter of the total cost of a system, so the higher panel prices barely moved what people paid.
Solar results breakdown
| Metric (2026, 100 responses) | Value |
|---|---|
| Average price per watt | $2.04/W |
| Median price per watt | $1.99/W |
| Standard deviation | $0.36/W |
| 25th percentile | $1.82/W |
| 75th percentile | $2.23/W |
| Lowest and highest | $1.30/W and $3.13/W |
| Average system size | 9.03 kW |
| Average solar cost (solar portion) | $17,956 |
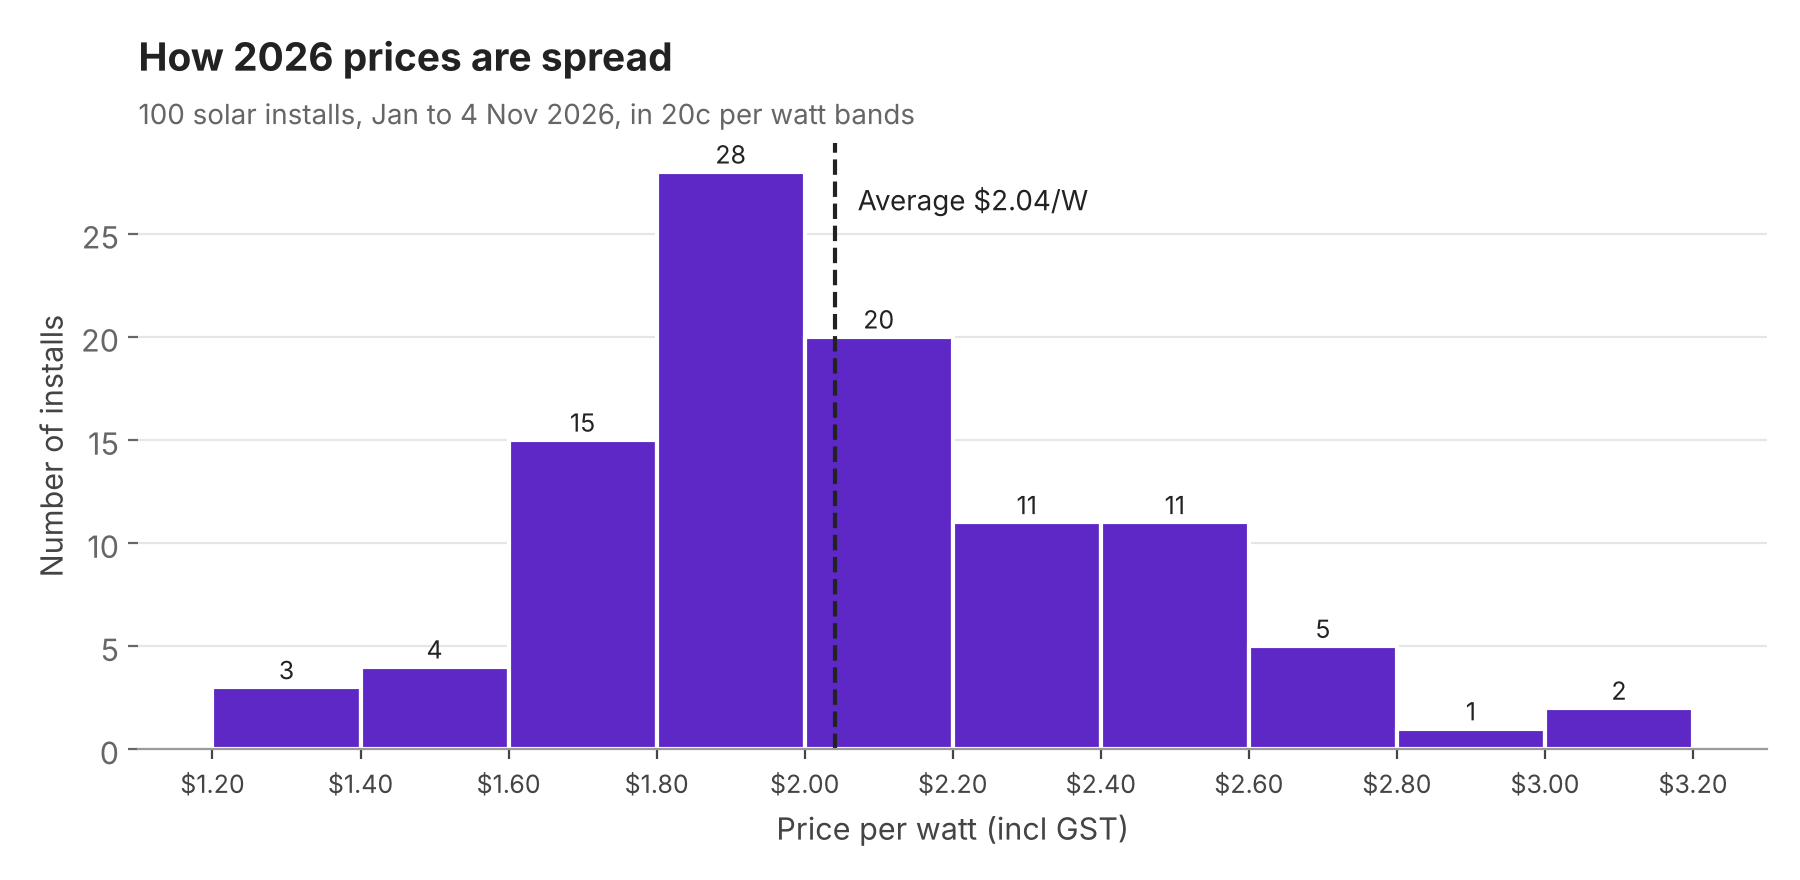
Most 2026 installs landed between $1.60 and $2.40 per watt
Three quarters of installs (74 of 100) came in between $1.60 and $2.40 per watt. Fewer than 1 in 5 went above $2.40. The dearest was a small 3 kW install at $3.13 per watt, which is typical: small systems carry the same fixed costs spread over fewer panels.
Why the difference?
Two homes can pay very different prices per watt for good reasons:
- System size. Fixed costs like scaffolding, electrician time and compliance get spread over more panels on bigger systems.
- Roof type and access. Steep, high or tricky roofs take longer and cost more.
- Inverter choice. Hybrid (battery-ready) inverters cost more than standard ones.
- Single vs three phase, plus any switchboard upgrades.
- Panel brand and the installer you choose.
My guess is that most installs below the $2.04 average were straightforward, standard jobs, while many of those above it had trickier roofs, switchboard upgrades or premium components.
Bigger systems still deliver better value, just less than last year
| System size | 2026 responses | 2025 avg $/W | 2026 avg $/W | Change | 2026 avg solar cost |
|---|---|---|---|---|---|
| 5 to 6 kW | 25 | $2.20 | $2.19 | -1c | $12,478 |
| 7 to 8 kW | 25 | $2.03 | $2.10 | +7c | $16,344 |
| 9 to 10 kW | 26 | $1.89 | $1.96 | +7c | $19,146 |
| 11 to 12 kW | 10 | $1.66 | $1.92 | +26c | $22,133 |
| 13 to 14 kW | 6 | $1.42 | $1.88 | +46c | $25,833 |
| 15 kW and up | 6 | not reported | $1.69 | $30,347 |
3 to 4 kW systems are left out: only 2 responses in 2026 (averaging $2.75/W). 2025 averaged $2.31/W for that band.
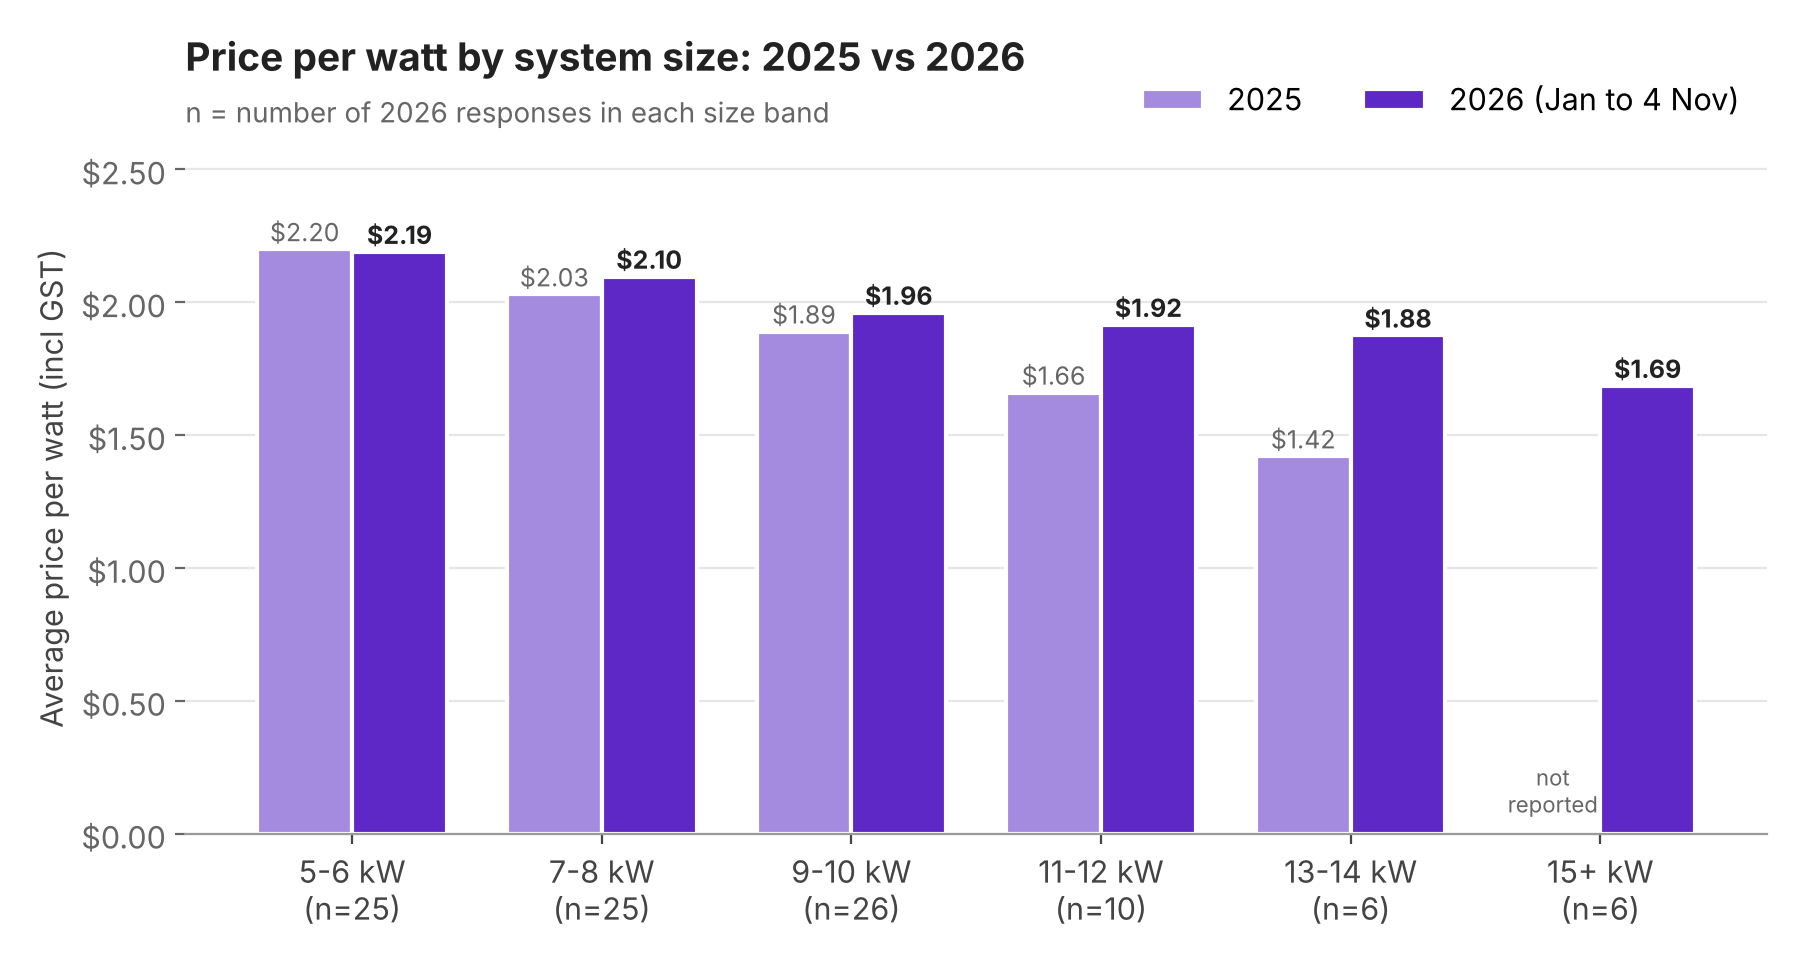
Bigger systems are still cheaper per watt, but the gap has narrowed
The pattern hasn't changed: the bigger the system, the lower the price per watt. A 5 to 6 kW system averaged $2.19 per watt, while systems 15 kW and up averaged $1.69.
What has changed is how steep that slope is. In 2025 the biggest systems looked like a real bargain at $1.42 per watt for 13 to 14 kW. This year that band came in at $1.88.
So how can the overall average be flat when most size bands are slightly up? It's the mix. People are buying bigger systems this year, and bigger systems cost less per watt. That pulls the overall average down and hides a small like-for-like increase.
A word of caution: the bigger bands only have 6 to 10 responses each, so one or two unusual jobs can swing them. The 5 to 10 kW bands (76 responses between them) are the most reliable, and they're within a few cents of last year (between 1c cheaper and 7c dearer per watt).
Rough guide: what will my system cost?
A quick rule of thumb is to multiply your system size in kW by $2,000. For a 10 kW system that's about $20,000, and our 9 to 10 kW band actually averaged $19,146.
Just remember smaller systems cost more per watt. A 5 kW system works out closer to $2.20 per watt, so roughly $11,000. That's not a quote, just a rough guide.
Systems are getting bigger
Average system size jumped from 7.89 kW in 2025 to 9.03 kW in 2026. The median went from 7 kW to 8.7 kW, 10 kW was the single most common size, and 39% of systems were 10 kW or larger. That lines up with the Electricity Authority's latest figures, which show new installs averaging about 9 kW in recent months.
Battery buyers are a big part of this. Homes that added a battery installed 10.1 kW of solar on average, compared with 8.1 kW for everyone else.
Panels are getting bigger too. Where people told us how many panels they got, the typical panel was 500 W, so a 10 kW system is now around 20 panels.
So why the jump? I think Kiwis are getting comfortable with the idea of going big. Sales reps are seeing customers get good results from bigger systems, and people are seeing their neighbours go big, so hey, why not go for gold? On top of that, electricity prices keep rising, so there's more incentive to make more of your own power.
Battery prices: still not cheap, still popular
Nearly half of 2026 installs (48 of 100) included a battery, up from about 42% in last year's survey. Another 24% chose a battery-ready (hybrid) inverter so they can add one later.
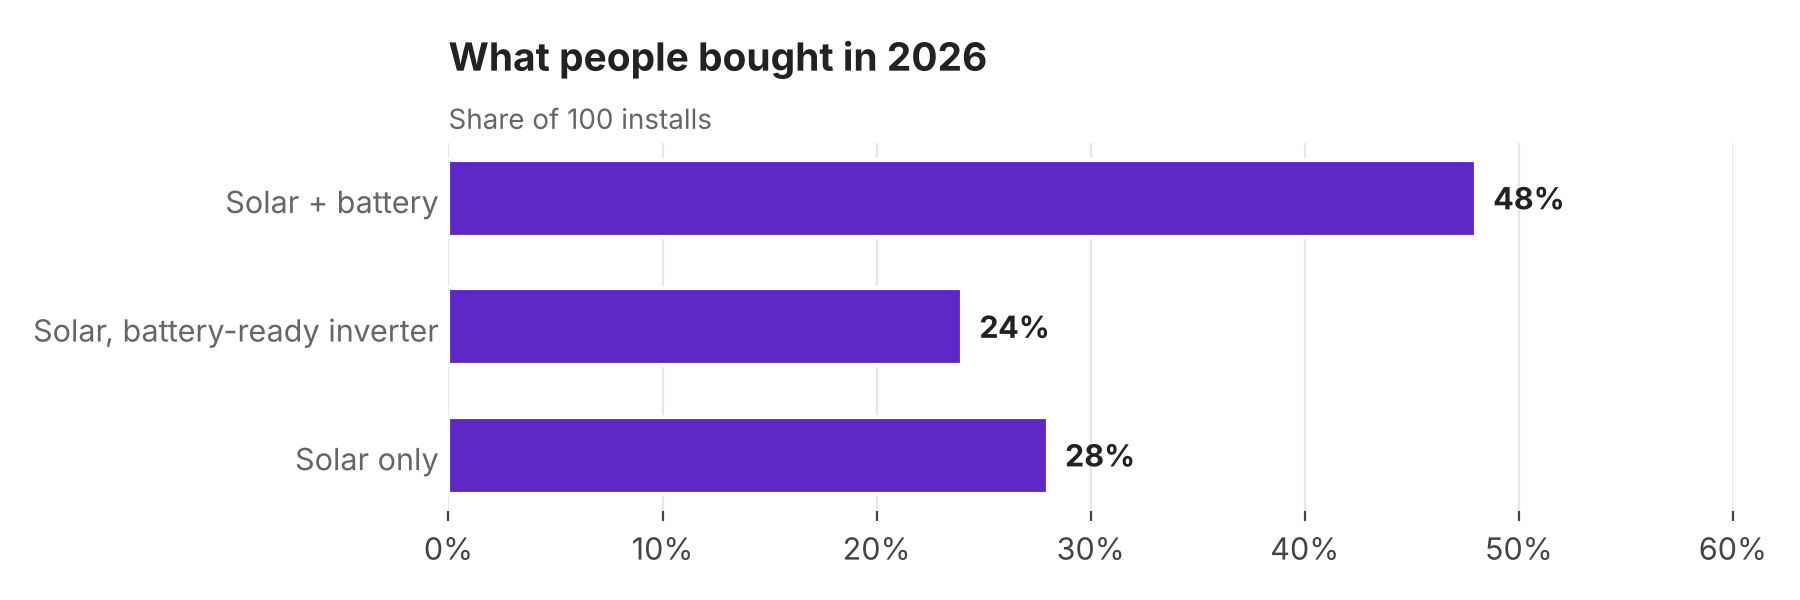
Nearly three in four homeowners bought a battery or went battery-ready
Battery statistics
| Metric | 2025 | 2026 |
|---|---|---|
| Battery responses | 63 | 48 |
| Average battery price (total) | $13,024 | $13,285 |
| Average price per kWh | $1,219/kWh | $1,165/kWh |
| Average installed size | 11.1 kWh | 11.5 kWh |
| Most common size | 13.5 kWh | 13.5 kWh |
| 13 kWh and above, per kWh | $1,105/kWh | $1,120/kWh |
| Under 13 kWh, per kWh | not reported | $1,215/kWh |
| Average solar + battery package | not reported | $33,098 (median $32,000) |
The average battery cost a little more than last year ($13,285 vs $13,024), but batteries are slightly bigger too. Per kWh, prices eased from $1,219 to $1,165, about 4% cheaper.
Bigger batteries are still better value per kWh. Batteries of 13 kWh and up averaged $1,120 per kWh, basically flat on last year, while smaller ones averaged $1,215.
Which batteries are Kiwis choosing?
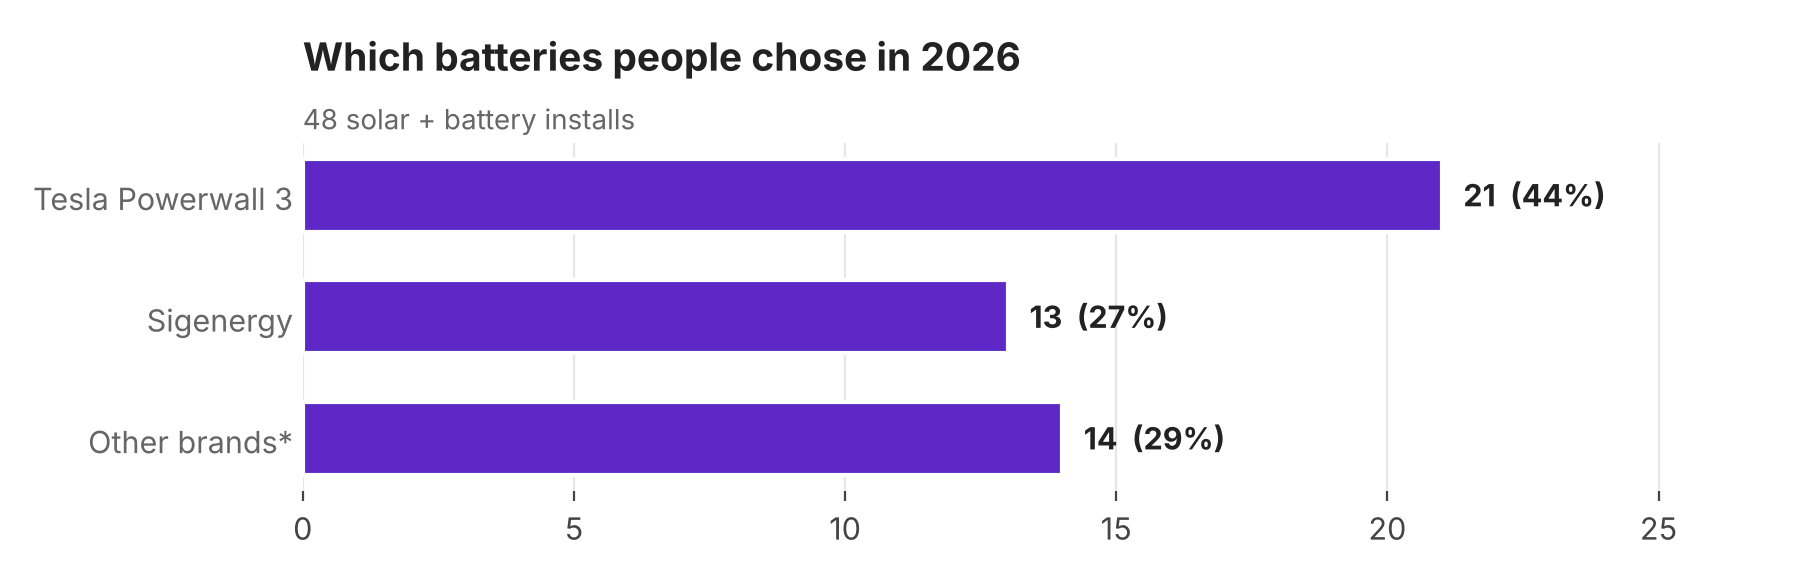
*Other brands: SolaX (3), AlphaESS (2), BYD (2), Pylontech (2), Fronius (2), Anker (1), GoodWe (1), not stated (1)
The Tesla Powerwall 3 dominated, turning up in 21 of 48 battery installs, with a median price of $15,000.
Sigenergy was second with 13 installs, mostly smaller 9 to 10 kWh setups averaging $10,773. One thing worth knowing: over half the Powerwalls in our survey (11 of 21) came from one installer that mainly fits Powerwalls. Take that installer out and Sigenergy comes out on top, so the Powerwall's top spot says as much about who is installing as what homeowners are choosing.
Not getting a battery yet? If you're going solar only for now, absolutely have a strategy for adding one later, and talk to your installer about it.
Did prices move during the year?
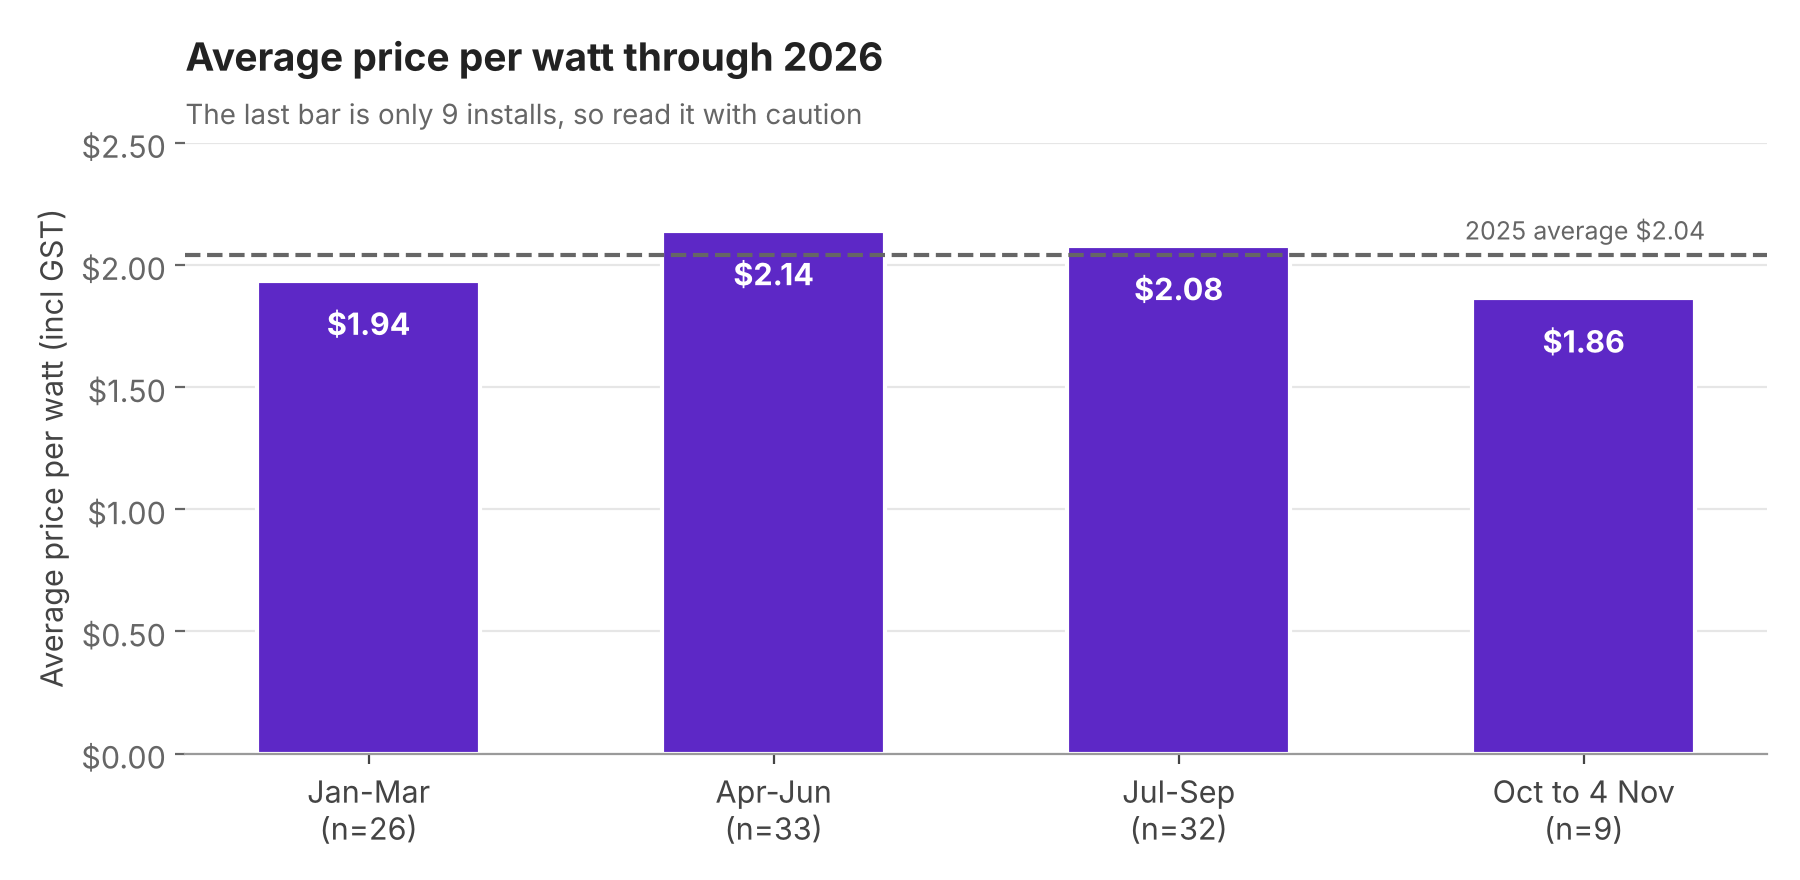
Prices bounced around $2 per watt all year
Not in any meaningful way. The first half of the year averaged $2.05 per watt and the second half $2.03. The quarter-to-quarter bounces are mostly down to which systems happened to be in each batch, not a trend.
What about regional prices?
| Region | 2026 responses | 2026 median $/W | 2025 median $/W |
|---|---|---|---|
| Canterbury | 28 | $1.90 | $2.08 |
| Waikato | 13 | $1.95 | $1.98 |
| Bay of Plenty | 12 | $1.86 | $1.81 |
| Otago | 9 | $2.00 | too few |
| Northland | 8 | $2.00 | too few |
| Nelson/Tasman | 8 | $2.25 | $2.23 |
| Wellington | 7 | $1.86 | $2.00 |
| Auckland | 7 | $2.00 | $1.95 |
| National | 100 | $1.99 | $2.00 |
Regions with fewer than 7 responses in 2026 are not shown.
Canterbury came in a little cheaper this year after sitting slightly above average last year. That kind of flip-flop is exactly why I don't read much into regional price differences. With most regions on 7 to 13 responses, the differences between them aren't statistically significant. Your installer, roof and system size matter far more than your postcode.
The one pattern worth watching is Nelson/Tasman, which was the priciest region in both years. My guess is it comes down to equipment. At least one of the main installers in the region prefers microinverters, which usually cost more than a standard string inverter, and with only 8 responses a handful of jobs like that is enough to lift the region's figure.
Looking ahead to 2027
I'll be honest: I expected prices to nudge up this year, and on the headline they didn't. Solar held flat and batteries got a bit cheaper per kWh, while people put the savings towards bigger systems and more storage.
I think the biggest driver of prices next year will be global demand. The world is trying its best to move away from imported fossil fuels, which are becoming more expensive and less reliable, and that will put a lot of strain on supply chains and the workforce.
We'll keep publishing this data every six months so you can see where prices are heading.
Final thoughts
If you're getting quotes right now, here's what the 2026 numbers tell you:
- About $2 per watt is still a fair benchmark for a typical home system. A quote above $2.40 per watt puts you in the dearest fifth of what people paid, so it deserves a question or two (unless it's a small system or a tricky roof).
- Bigger systems are still cheaper per watt, so size for where your power use is heading, not just where it is today.
- Not ready for a battery? A battery-ready inverter keeps the door open.
- Compare at least three quotes. It's the easiest way to check you're paying a fair price.
My overall take: with prices holding flat, the argument for waiting for prices to drop is out the door. A typical solar power system anywhere in New Zealand will save you a couple of thousand dollars a year.
Get 3 free quotes from trusted, vetted local installers. Want a feel for your savings first? Try our Solar Calculator.
Quick answers
How much does solar cost in NZ in 2026?
About $2.04 per watt installed, including GST. The average system in our survey was 9 kW and cost about $18,000.
How much does a 10 kW solar system cost in NZ?
Systems in the 9 to 10 kW range averaged $19,146 in 2026, or $1.96 per watt.
How much does a home battery cost in NZ?
The average battery cost $13,285 installed, about $1,165 per kWh. A Tesla Powerwall 3 had a median price of $15,000.
Have solar prices dropped in 2026?
No. The average price per watt was $2.04 in both 2025 and 2026.
About the data
These figures come from the My Solar Quotes price survey, where homeowners tell us what they actually paid for their solar and battery install. The 2026 data covers 100 installs from 1 January to 4 November 2026, across 13 regions and 41 different installers. All prices include GST. Price per watt uses the solar portion of the price only, with battery costs separated out. Installer names are anonymised.
2025 figures are from our April 2026 article, The $2 Per Watt Reality (151 solar responses and 63 battery responses, January to December 2025).






Post your own comment