

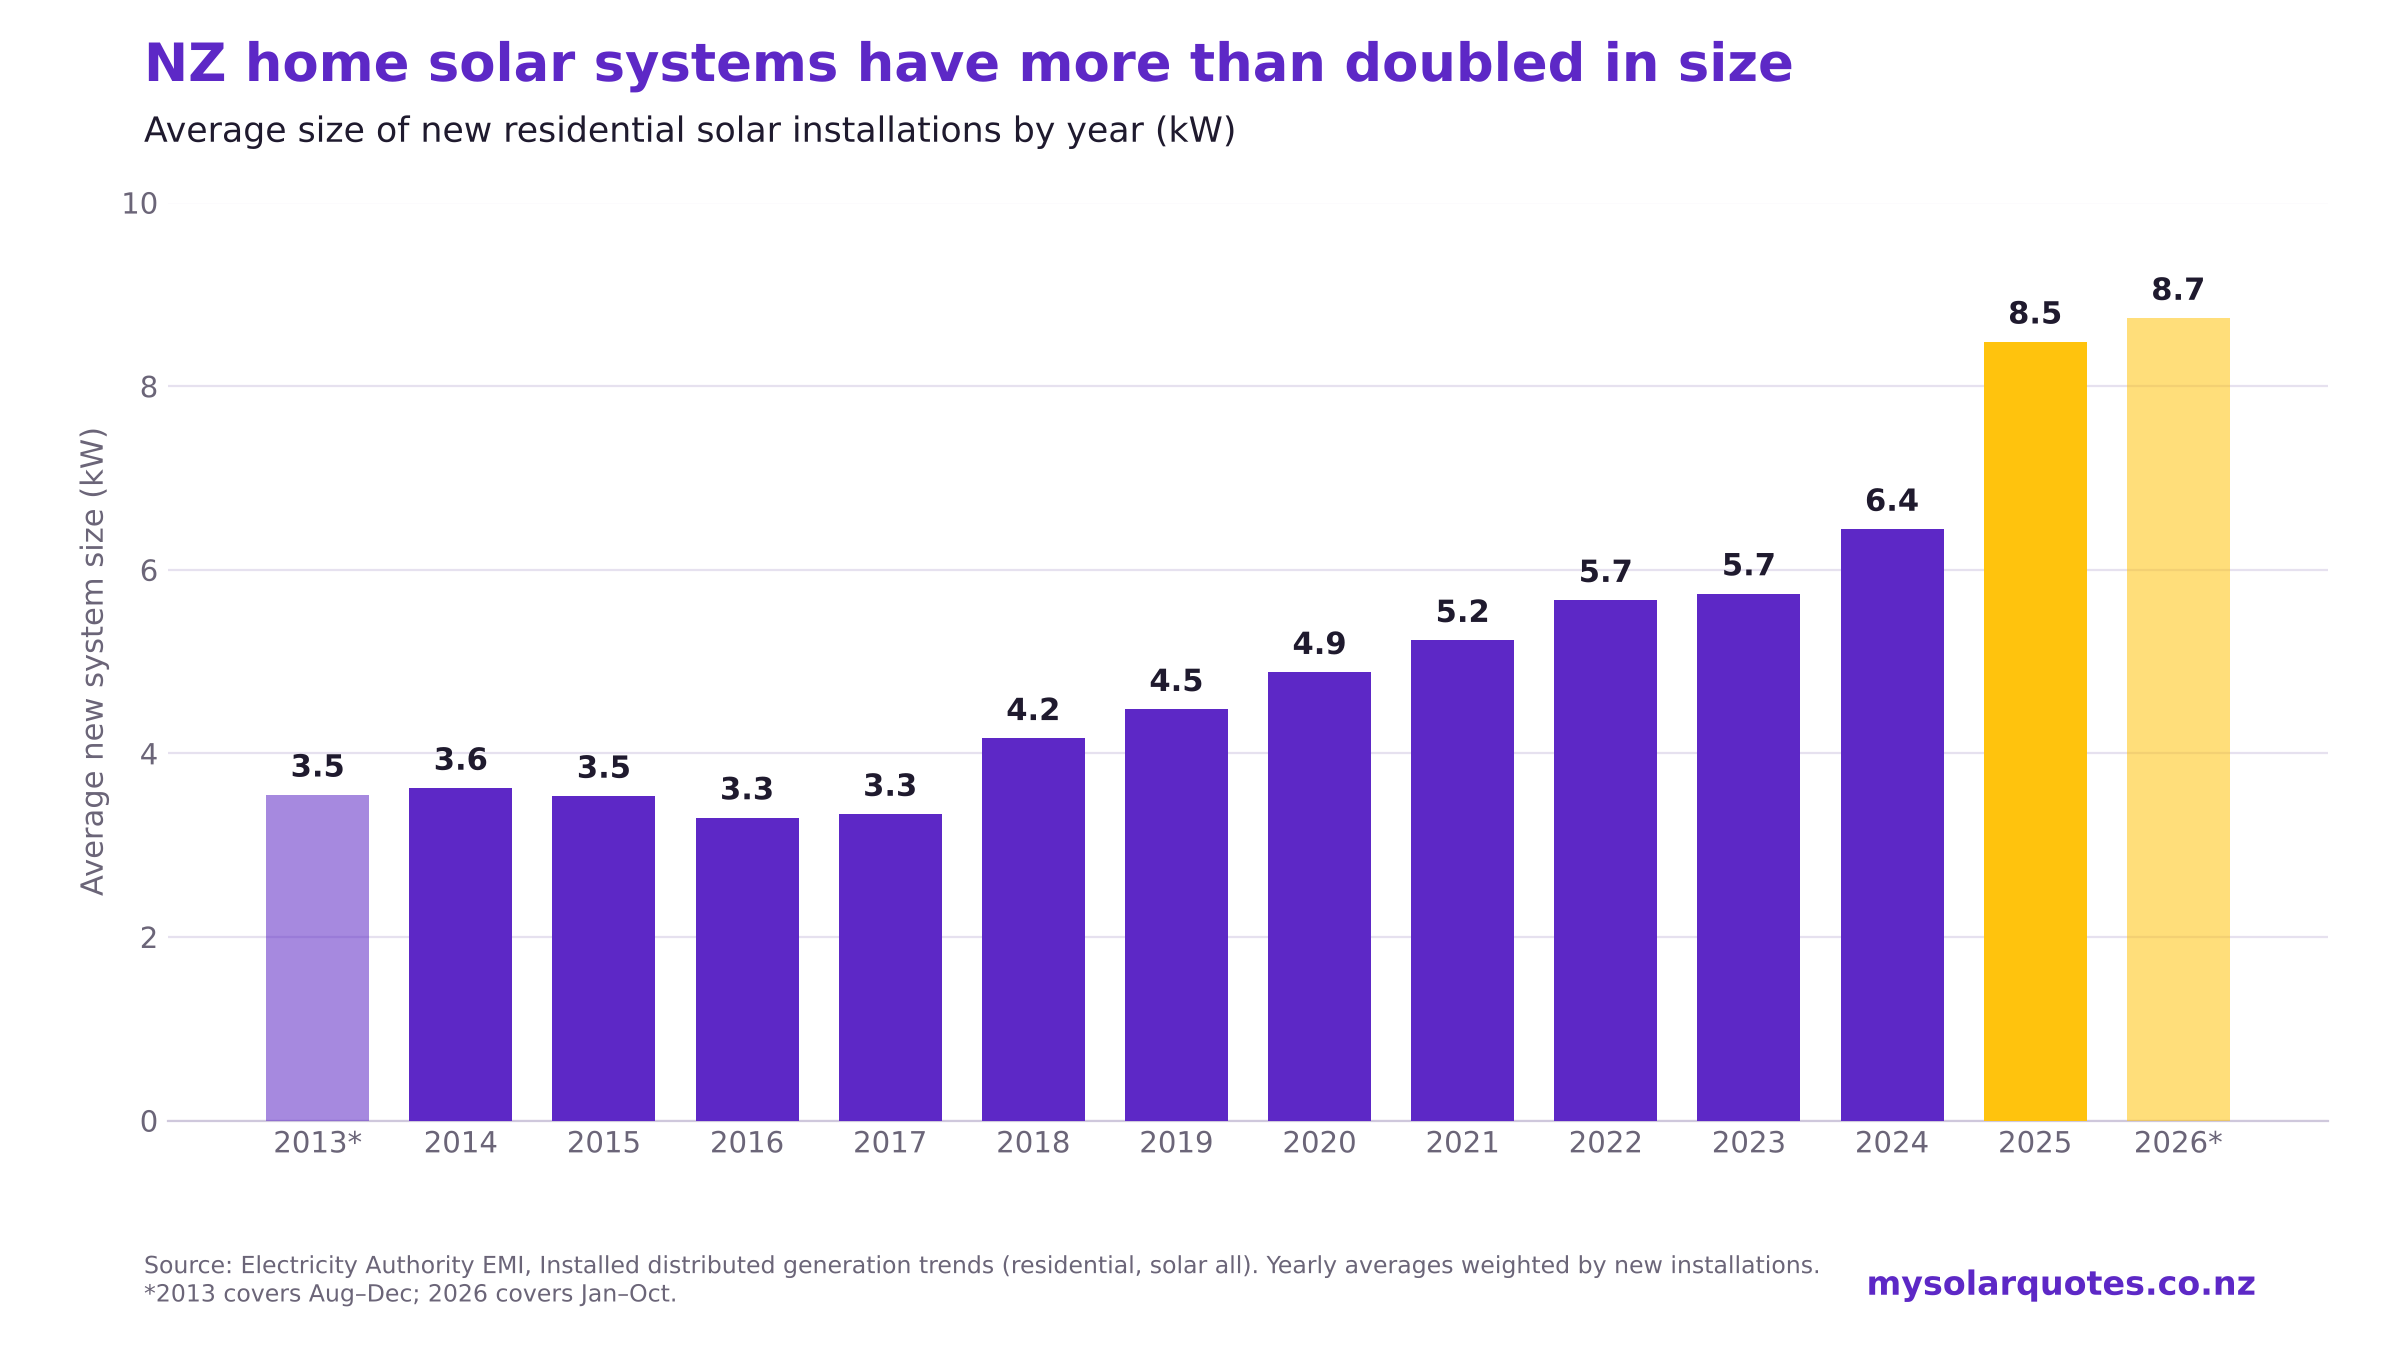
The average new home solar system in New Zealand has reached 8.7 kilowatts in 2026. Back in 2014, it was just 3.6.
But what caught my eye was how quickly things shifted last year. In 2025, the average jumped from 6.4 to 8.5 kilowatts. After years of fairly gradual growth, that’s a decent leap.
There are more systems going in, too. Around 13,200 new residential installations were recorded in the first ten months of 2026- already more than in the whole of 2025.
My take? The thinking behind home solar has changed. We used to size systems around what a household could use while the sun was shining. Now batteries, EVs and lower panel costs have given people good reasons to think bigger.
That doesn’t mean everyone needs to fill their roof. But the old advice to keep your system small deserves another look.
When 3 or 4 kilowatts was the sensible option
Between 2013 and 2017, the average new system barely budged, sitting between 3.3 and 3.6 kilowatts.
There was a reason for that. Sending spare solar power back to the grid generally earned you peanuts compared with what you paid to buy electricity. The aim was to use as much of your solar as possible at home.
For many households, going bigger meant paying for extra panels whose output would mostly be exported at a low rate. You generated more electricity, but your investment could take longer to pay for itself.
Small systems weren’t a failure of ambition. They often stacked up better.
Then bigger systems started making more sense
From 2018, the average rose every year, reaching 6.4 kilowatts in 2024.
Falling panel prices helped. Once you’re paying for an installer to get onto your roof, adding a few more panels can be relatively inexpensive. The cost of a larger system doesn’t necessarily rise at the same rate as its output.
Batteries also changed the calculation. Spare solar could be saved for dinner time instead of being sold to the grid during the day. That gave households another use for the power from a bigger array.
Then came the banks’ green loans. Around 2022, low-interest lending made solar easier to fund for eligible homeowners. ANZ launched its 1 percent Good Energy loan. BNZ and ASB followed suit. Westpac expanded its interest-free Warm Up loan and added batteries.
Those loans didn’t make solar free, but they took some pressure off the upfront budget. I suspect that helped people choose the system they wanted, rather than trimming it back to what they could pay for immediately.
New installations rose from around 5,900 in 2021 to 8,800 in 2022. Cheap finance won’t explain all of that, but I’d be surprised if it didn’t play a part.
Why the sudden jump in 2025?
The move from 6.4 to 8.5 kilowatts in one year is the standout in this data.
I don’t think there’s one tidy explanation. Several things have been pushing in the same direction.
Panels were about as cheap as they’ve ever been. After years of overproduction in China, wholesale panel prices hit historic lows of around US$0.07-0.09 per watt in 2024 and early 2025. When the panels themselves cost that little, adding a few more to a quote barely moves the price.
Batteries have become a much more common consideration. Once you’re planning to supply the house during the day and charge a battery for the evening, you have a reason to add more panels.
EVs have added another sizeable electricity bill. A car can soak up a fair bit of solar- provided it’s home to charge during the day. Simply owning an EV doesn’t mean all that extra solar will go into it.
None of these changes happened overnight, so I wouldn’t credit any one of them with the 2025 jump. But together, they help explain why larger systems are becoming more common.
What about 2026?
The average is still growing in 2026, but more slowly, up from 8.5 to 8.7 kilowatts so far.
Part of that is simply that the battery effect can’t keep doubling forever. Once a battery becomes a normal part of the package, it stops pushing sizes up quite so sharply.
Panels have also got dearer. China scrapped its export tax rebate on solar panels from 1 April 2026, freight rates out of China more than doubled, and Chinese panel prices were about 20 percent higher in October than in mid-December.
A new 10 kilowatt export limit. In April 2026 the Electricity Authority announced that lines companies must default to a 10 kilowatt export limit for home solar and batteries, from May 2026. That’s a limit on power sent to the grid, rather than the total panel capacity on the roof, and local network conditions still matter. It only started influencing buying decisions this year, so it had nothing to do with the 2025 jump. I expect its effect will show up more in 2027 numbers.
Bigger can stack up better. It isn’t a given.
This is where I think the advice needs a bit more care.
Years ago, extra panels could drag out your payback. Today, lower panel costs mean a larger system can offer better value, even if you export a reasonable share of its generation.
But “bigger is always better” is just as unhelpful as “keep it small”.
A battery gives you somewhere to put spare solar, but it also adds cost. An EV increases your electricity use, but when you charge matters. And a generous buy-back rate can make the numbers look good, without being guaranteed for the life of the system.
The small-system rule has had its day
To me, the interesting part of these figures is how far we’ve moved from treating solar as a small daytime top-up.
More households are sizing it around batteries, transport and a bigger share of their overall electricity use. An 8 or 9 kilowatt system would once have looked fairly large for a home. It’s now close to the average for new installations.
That’s a substantial shift. Advice that made sense ten years ago shouldn’t get a free pass today.
Neither should a bigger quote simply because “that’s what everyone’s doing”. The extra panels still need to earn their keep.
About the data
The figures come from the Electricity Authority’s Installed distributed generation trends report, covering residential solar connections with and without batteries.
We calculated yearly averages from the monthly figures, weighted by the number of installations each month. The 2013 figures cover August to December; 2026 covers January to October.
These are the average sizes of new installations, rather than all solar systems already installed. The figures show the change in size; the reasons discussed above are my interpretation of that trend.






Post your own comment