

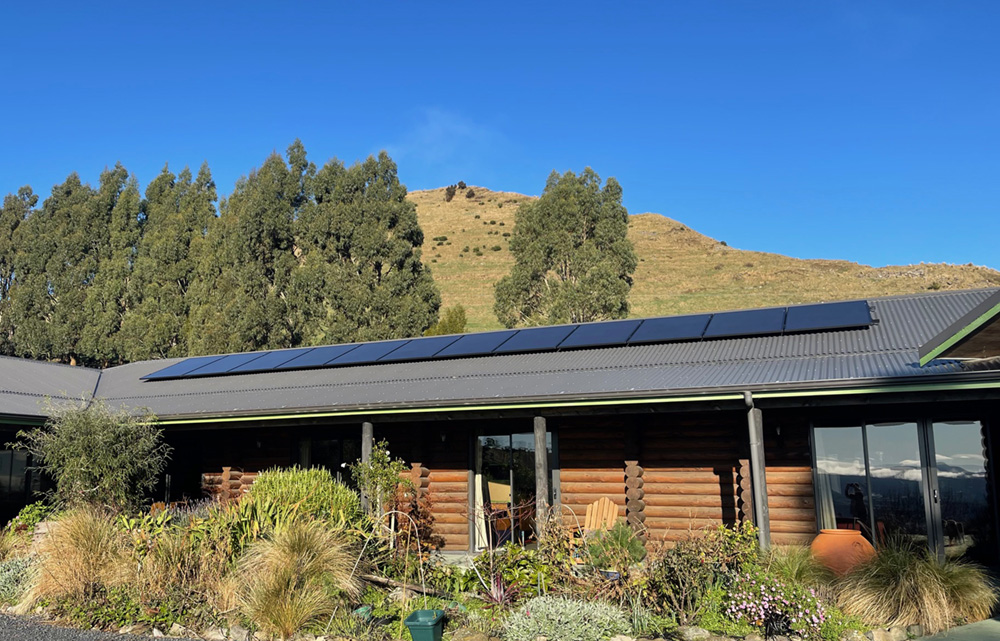
Over the last 12 months, Kiwis have installed 13,455 new residential solar systems, with an average size of 8.3kW.
That’s roughly 18 to 20 panels per roof - quite a jump from the 3kW and 4kW systems that were common a decade ago. And system sizes are still growing. In August 2026 alone, the average new residential system was 9.08kW.
These figures come from the Electricity Authority’s EMI data, which tracks registered grid-connected solar systems across New Zealand, month by month. So we’re looking at actual installations here, rather than survey results or estimates.
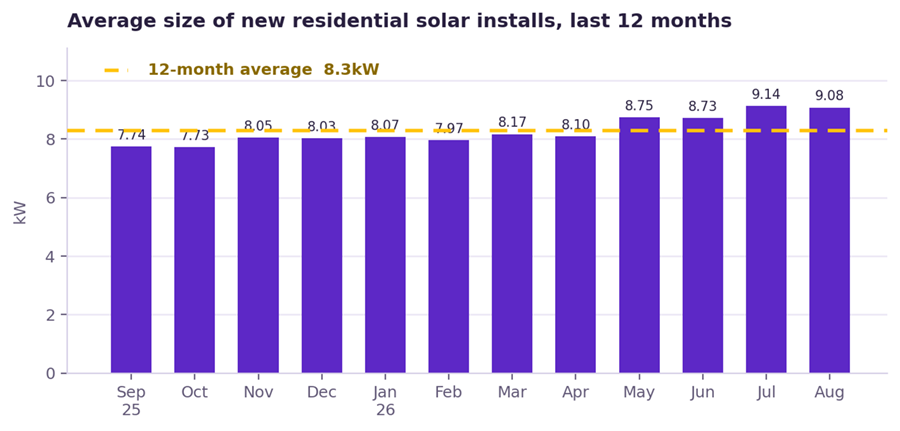
The average system size varies from month to month, but the trend is clear - Kiwis are going bigger. For the first half of the year, the average hovered around 8kW. Since May, it hasn’t dipped below 8.7kW.
So why is the average system also quoted as 5.79kW?
It comes down to which systems you’re counting.
The 8.3kW figure is the average for new residential systems installed over the last 12 months. The 5.79kW figure includes all residential systems already installed, right back to those smaller systems fitted a decade ago that are still happily generating power.
Those older systems keep the overall average lower, and it takes time for bigger new installations to shift it.
Here is where that installed base sits as at August 2026:
| System type | Average size |
|---|---|
| All residential solar | 5.79kW |
| Solar without a battery | 5.18kW |
| Solar with a battery | 7.68kW |
These figures describe recorded generation capacity in kW, not battery storage capacity in kWh. EMI does not record the size of the battery people install, only the solar capacity installed alongside it.
Both figures are useful - they just tell us different things. 5.79kW tells us the average size of systems already on Kiwi roofs. If you’re considering solar for your own home, the 8.3kW average gives you a better idea of what people are choosing today. Your ideal size will still depend on how much power you use, your roof space and your budget.
The gap between the two is getting wider
Here’s where it gets interesting. New installs have always been bigger than the national average, but the distance between them is growing quickly.
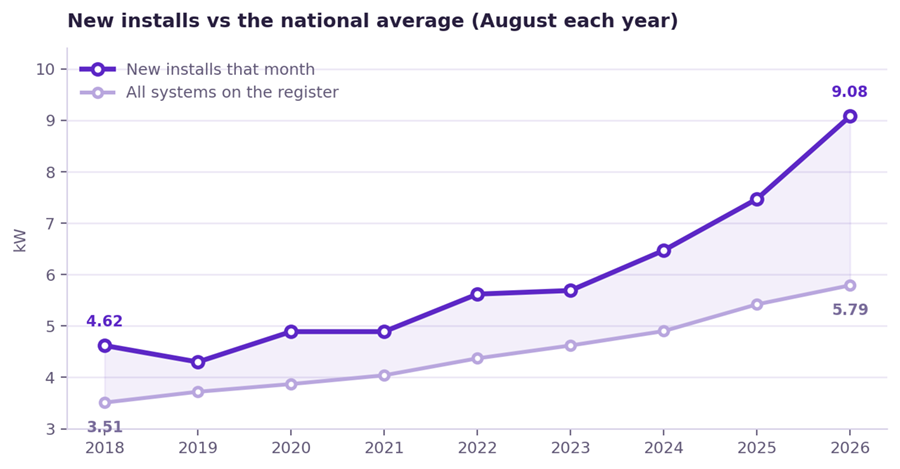
In August 2018, the average new system was 4.62kW, compared with 3.51kW across all residential systems. That’s a gap of around 1.1kW.
By August 2026, new systems averaged 9.08kW, while the overall average was 5.79kW. That gap had grown to 3.3kW - three times what it was eight years earlier.
So new residential systems have almost doubled in size in eight years, increasing by 97%. The overall average rose by 65% over that same period. If you only look at the national average, you miss just how much bigger Kiwis are going with new solar installations.
Why systems keep getting bigger
Panels keep getting cheaper. Solar panels typically get cheaper every year. Manufacturing scale, better cell efficiency, bigger panel formats. The panels themselves are now a surprisingly small slice of what you pay for a system.
Labour is not getting cheaper. You’re paying for the installers’ time, scaffolding, travel, compliance and an electrician to connect it all up. Many of those costs are much the same whether you install 12 panels or 18. A few extra panels won’t necessarily mean another day on the roof, so going bigger can give you more solar for your money.
Meaning payback improves as you go bigger. Our data analysis of actual payback periods for NZ homeowners backs this up. Bigger systems don’t just generate more power - they generally give you more for your money. If you’re putting solar on your roof, it’s worth sizing it for what you’ll need now and in the future. Going too small could cost you more in the long run.
We’ve got more things to power. EVs are the clearest example - adding roughly 2,000 to 3,000kWh a year to a household’s electricity use, depending on how much you drive. Solar and EVs make a great match, so even if an EV isn’t in the driveway yet, it’s worth allowing for one when sizing your system. The same goes if you’re planning to swap gas for electric hot water or induction cooking.
Battery homes install noticeably more solar
Homes with a battery average 7.68kW of solar. Homes without one average 5.18kW. That is a 2.5kW difference, and it is not an accident.
Without a battery, every kilowatt-hour your panels make that you are not using right at that moment gets exported to the grid. You get paid for it, but nowhere near what you pay to buy power back. Buy-back rates sit well below retail, so exported solar is worth maybe a third to a half of self-consumed solar.
That puts a natural ceiling on system size. Once you have covered your daytime load, every extra panel is earning the low rate rather than the high one, and adding more stops paying off.
A battery removes that ceiling. The midday surplus now has somewhere useful to go. It gets stored and used at 6pm when the oven and the heat pump are running, which means it is worth full retail instead of buy-back. Suddenly a bigger array makes sense, because you can actually consume what it makes.
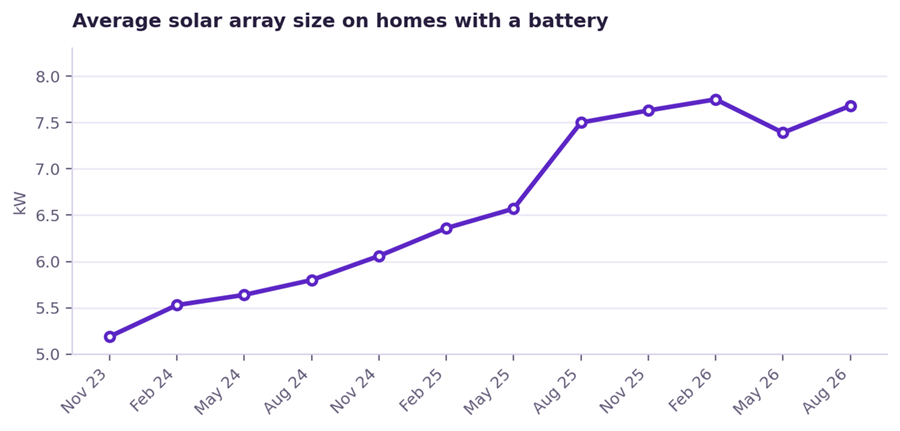
One caveat on the battery figures. The electricity registry did not have a separate solar plus battery category until November 2023, so anything before that was recorded inconsistently. That is why this trend line starts where it does. In under three years the average battery home has gone from a 5.2kW array to 7.68kW, and the number of homes in that category has grown from around 3,000 to more than 18,000.
System sizes by region
Averages vary around the country. The first column is every residential system currently on the register in that region. The second is the average size of systems newly installed there over the last twelve months, weighted by how many went in each month.
| Region | Homes with solar | All systems | New installs, last 12 months |
|---|---|---|---|
| Northland | 5,783 | 5.53kW | 8.06kW |
| Auckland | 15,489 | 5.37kW | 8.40kW |
| Waikato | 8,967 | 6.11kW | 9.81kW |
| Bay of Plenty | 7,296 | 6.00kW | 8.86kW |
| Gisborne | 603 | 4.67kW | 5.50kW |
| Hawke's Bay | 4,412 | 5.81kW | 9.16kW |
| Taranaki | 2,514 | 6.53kW | 8.49kW |
| Manawatu-Whanganui | 3,989 | 6.02kW | 8.90kW |
| Wellington | 7,696 | 5.70kW | 8.43kW |
| Tasman | 2,202 | 6.52kW | 8.89kW |
| Nelson | 1,713 | 5.58kW | 7.59kW |
| Marlborough | 1,614 | 5.43kW | 6.00kW |
| West Coast | 323 | 6.77kW | 8.17kW |
| Canterbury | 14,584 | 5.82kW | 7.13kW |
| Otago | 5,605 | 5.94kW | 8.99kW |
| Southland | 925 | 5.73kW | 7.45kW |
Every region without exception is installing bigger systems today than its own historical average, and in most cases by 2kW to 3kW. But the two columns rank the regions quite differently, which is the interesting part.
Ignore Gisborne. There were only 40 new systems in the entire region over twelve months, and several of those months record a flat 5.000kW, which looks like a default value rather than a measurement. Both Gisborne columns are noise. The West Coast, at 111 new installs, is thin for the same reason, though less so.
Waikato installs the biggest systems in the country. At 9.81kW over the last year it is comfortably ahead of everywhere else, and consistently so: every single month in the period landed between 8kW and 11kW. This is not one big install skewing things.
Canterbury is the busiest market but not the biggest systems. 2,726 new installs in twelve months, more than any other region by a clear margin, yet an average of 7.13kW, well below the national 8.3kW.
Auckland looks very different depending on which column you read. Its installed base is the second smallest in the country at 5.37kW, which fits the usual explanation: denser housing, more townhouses and terraces, smaller and more broken-up roofs, more shading. But its new installs average 8.40kW, slightly above the national figure. Whatever roof constraints Auckland has, they are not holding back what is going on today nearly as much as the fleet average suggests.
Provincial and rural regions cluster at the top. Hawke's Bay 9.16kW, Otago 8.99kW, Manawatu-Whanganui 8.90kW, Tasman 8.89kW, Bay of Plenty 8.86kW. More standalone homes on bigger sections with simpler, larger roof planes, and a lot of lifestyle blocks with bigger loads attached. Sheds, workshops, bore pumps, water pumps, sometimes more than one EV in the driveway. More roof and more to power pushes system sizes up.
What size should you choose?
The national average is useful context, but your home does not need an average system.
Look at your electricity use, when you use it, your usable roof space and what might change over the next few years. A battery, EV or move from gas to electric hot water can all change the calculation.
My advice? Do not automatically choose the smallest system because it has the lowest upfront price. And do not automatically ask for the system you would have bought five years ago either. Panels are the cheap part now. Getting the crew on your roof is the expensive part, and you only want to pay for that once.
Ask your installer to show you what the next size up costs, how much extra electricity you are likely to use, and what that does to the projected payback.
Sometimes a few more panels make a lot of sense. You can also see how much each solar system size costs.
And if you are considering a battery, or think you might add one later, size the array with that in mind. A battery with too few panels to fill it is an expensive way to store not very much.
Get three free quotes from trusted installers
Data source: Electricity Authority, EMI installed distributed generation trends, residential connections. All figures to 31 August 2026. Twelve-month new-installation averages cover September 2025 to August 2026 and are weighted by monthly install volume.






Post your own comment